
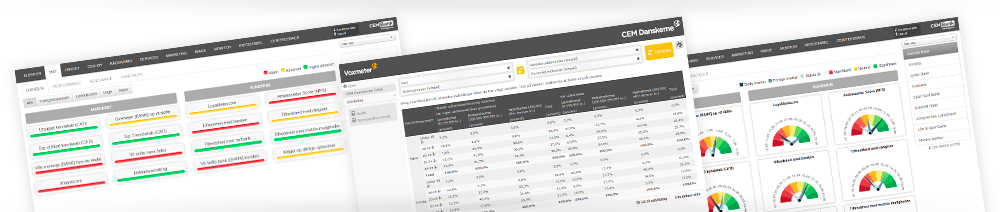
Portals
Create professional reporting portals with great flexibility.
Access management allow you to decide which data different users should see.

Table set
Use table sets to gain a quick overview of your data.
Select the variables you wish to examine, or use scripting to generate them automatically.

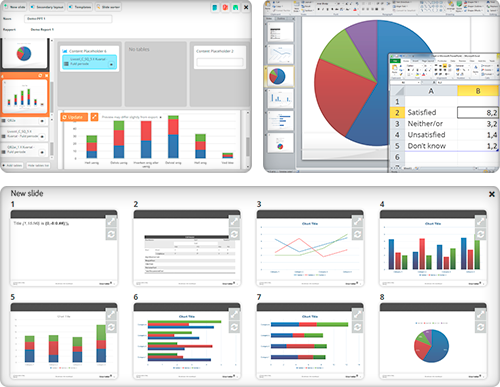
PowerPoint
Catglobe allows you to edit your data after exporting it to PowerPoint.
It is a great tool for visual presentation.

Raw Data
Use Catglobe to provide raw data if you wish to process it yourself.
We can deliver raw data in Excel, SPSS, CSV etc.
Direct data directly into your presentations
Afterwards, you can easily treat and edit your data further
Present results using your company’s graphic expression in PowerPoint. You are not only exporting pictures, but all the data will be directly exported into PowerPoint.
Therefore, you can easily continue working with the data and make any desired visual adjustments.
It has never been more easy and convenient to work with data after the data collection.
Automatically trigger the right actions with project management
Trigger actions
The database allows you to
set up workflows and
trigger alarms that activates
automated actions when
certain conditions are met.
Data and Metadata
in one singe database
This gives you a unique
opportunity to cross any movement,
action and question without
ever relocating data from
project to project again.
Data Export
You can export directly to
Excel, PowerPoint, SPSS etc.
Hereafter, you are able to
take your work further – your
export jobs are saved , so
you don’t have to start over.